


While most steel producer stocks are trading down in 2024, Steel Dynamics Inc. (NASDAQ: STLD) is an exception. Its stock is trading up 9.1% year-to-date (YTD). The VanEck Steel ETF (NYSEARCA: SLX) is down 9.67% YTD. Incidentally, a number of steel companies lowered their guidance, which caused their shares to sell off. On June 17, 2024, Steel Dynamics lowered its Q2 2024 EPS guidance, but surprisingly, shares rebounded to close up 3% on the day. The reaction has investors wondering what makes Steel Dynamics' stock bullet-proof while its peers' stocks rust away.
Steel Dynamics operates in the basic materials sector and competes with steel producers, including Nucor Co. (NYSE: NUE), down 9.1% YTD, United States Steel Co. (NYSE: X), down 22.3% YTD, Cleveland Cliffs Inc. (NYSE: CLF), down 24.6% YTD, and Olympic Steel Inc. (NASDAQ: ZEUS), down 32.7% YTD.
Revisiting Steel Dynamics Inc.'s Q1 2024 Earnings
On April 23, 2024, Steel Dynamics reported Q1 2024 EPS of $3.67, beating consensus analyst estimates by 16 cents. Revenues fell 4.1% YoY to $4.69, falling short of the $4.74 billion consensus estimates. The company stated that it remains confident that domestic steel consumption will be strong throughout 2024. Order activity continued to be solid across its businesses, and steel prices remained firm. U.S.-produced steel products coupled with lower imports should support steel pricing. The company expects the automotive, industrial, non-residential construction, and energy sectors to remain bullish. Significant investment is expected to be derived from public funding related to the U.S. Infrastructure spawned by the Inflation Reduction Act (IRA) and Department of Energy programs.
Like Dominoes, Steel Companies Lower Their Guidance
On June 14, 2024, Nucor lowered its Q2 2024 EPS guidance to $2.20 to $2.30 versus $3.00 consensus estimates primarily due to lower earnings in the steel mills segment due to lower average selling prices and volumes.
On June 17, 2024, U.S. Steel lowered its adjusted EBITDA guidance for Q2 to $425 million from the previous forecast of $425 to $475 million. EPS guidance was flat at 76 to 80 cents versus 77-cent consensus estimates.
On June 17, 2024, Steel Dynamics followed suit and lowered its Q2 2024 EPS guidance to $2.64 to $2.68 versus $2.98 consensus estimates. The main driver is lower realized pricing, offsetting steady shipments. Underlying domestic steel demand remains intact, but steel-buying hesitancy has grown due to the weakening of the scrap price environment. Demand continues to be led by the automotive, energy, non-residential, and industrial sectors.
Optimistic Forecasts for Steel Dynamics in Q2 2024
Steel Dynamics expects Q2 2024 metal recycling operations earnings to be higher than Q1 results due to more substantial volumes in ferrous and nonferrous materials. Its steel fabrication operations are expected to align with Q1 2024 results based on increasing shipments offset by incrementally lower realized pricing. The non-residential construction sector remains solid, as evidenced by deck orders and steel joist backlog volume extending into the historically strong product pricing in the fourth quarter of 2024. Continued onshoring of manufacturing and robust U.S. infrastructure programs and industrial buildouts support strong demand for the coming years. The company purchased $247 million or 1.1% of its common stock through the second quarter to June 10, 2024.
Steel prices have fallen, as evidenced by the 37% plunge in hot-rolled steel prices in 2024. This impacts steel producers dramatically. However, the markets may have priced in the bad news, causing steel stocks to rally.
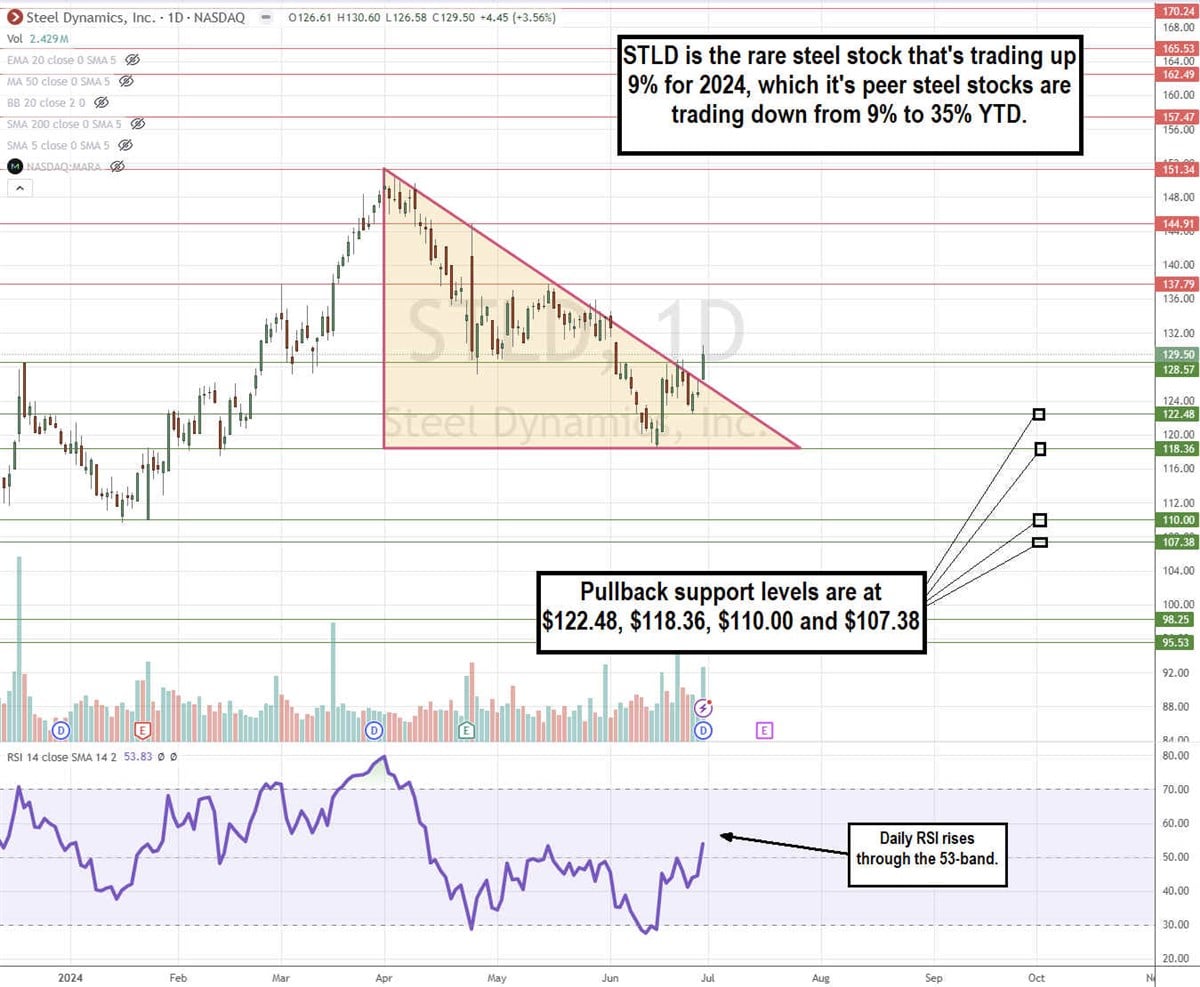
STLD is Attempting to Breakout of a Descending Triangle Pattern
The daily candlestick chart for STLD shows a descending triangle pattern. The descending trendline commenced at $151.34, capping tops toward the $118.36 flat-bottom lower trendline support. STLD stock is attempting to break through the descending trend at $126.34. The daily relative strength index (RSI) is coiling up through the 53-band. Pullback support levels are at $122.48, $118.36, $110.00, and $107.38.
Steel Dynamics analyst ratings and price targets are at MarketBeat.
