
Safety and specialty services provider APi (NYSE:APG) missed Wall Street’s revenue expectations in Q3 CY2024 as sales rose 2.4% year on year to $1.83 billion. The company’s full-year revenue guidance of $7 billion at the midpoint also came in 1.8% below analysts’ estimates. Its non-GAAP profit of $0.51 per share wasin line with analysts’ consensus estimates.
Is now the time to buy APi? Find out by accessing our full research report, it’s free.
APi (APG) Q3 CY2024 Highlights:
- Revenue: $1.83 billion vs analyst estimates of $1.88 billion (2.7% miss)
- Adjusted EPS: $0.51 vs analyst expectations of $0.51 (in line)
- EBITDA: $245 million vs analyst estimates of $244.5 million (small beat)
- The company dropped its revenue guidance for the full year to $7 billion at the midpoint from $7.25 billion, a 3.4% decrease
- EBITDA guidance for the full year is $895 million at the midpoint, in line with analyst expectations
- Gross Margin (GAAP): 31.1%, up from 28.6% in the same quarter last year
- Operating Margin: 7.8%, up from 5.8% in the same quarter last year
- EBITDA Margin: 13.4%, in line with the same quarter last year
- Free Cash Flow Margin: 10.8%, up from 7.1% in the same quarter last year
- Organic Revenue was flat year on year (1.3% in the same quarter last year)
- Market Capitalization: $9.12 billion
Russ Becker, APi’s President and Chief Executive Officer stated: “The team’s work over the last few years executing our strategy has resulted in APi being the strongest it has ever been with 2024 shaping up to be a year of record net revenues, margins and free cash flow generation. As we plan for a return to accelerated organic growth in 2025 complemented by strong operating performance, I am proud of the team's execution of our strategy. We are well positioned to achieve our 13% plus adjusted EBITDA margin target in 2025 and set new meaningfully higher targets for the following three years which we will review during our 2025 investor day. As we shift our focus to 2025, we have great confidence in the business, our backlog, our balance sheet, and our ability to accelerate growth and expand margins to build on our already strong foundation. Our business has significant opportunities ahead and we look forward to leveraging these opportunities as we update you on our progress. "
Company Overview
Started in 1926 as an insulation contractor, APi (NYSE:APG) provides life safety solutions and specialty services for buildings and infrastructure.
Construction and Maintenance Services
Construction and maintenance services companies not only boast technical know-how in specialized areas but also may hold special licenses and permits. Those who work in more regulated areas can enjoy more predictable revenue streams - for example, fire escapes need to be inspected every five years–. More recently, services to address energy efficiency and labor availability are also creating incremental demand. But like the broader industrials sector, construction and maintenance services companies are at the whim of economic cycles as external factors like interest rates can greatly impact the new construction that drives incremental demand for these companies’ offerings.
Sales Growth
A company’s long-term performance is an indicator of its overall business quality. While any business can experience short-term success, top-performing ones enjoy sustained growth for multiple years. Luckily, APi’s sales grew at an impressive 11.2% compounded annual growth rate over the last five years. This is a useful starting point for our analysis.
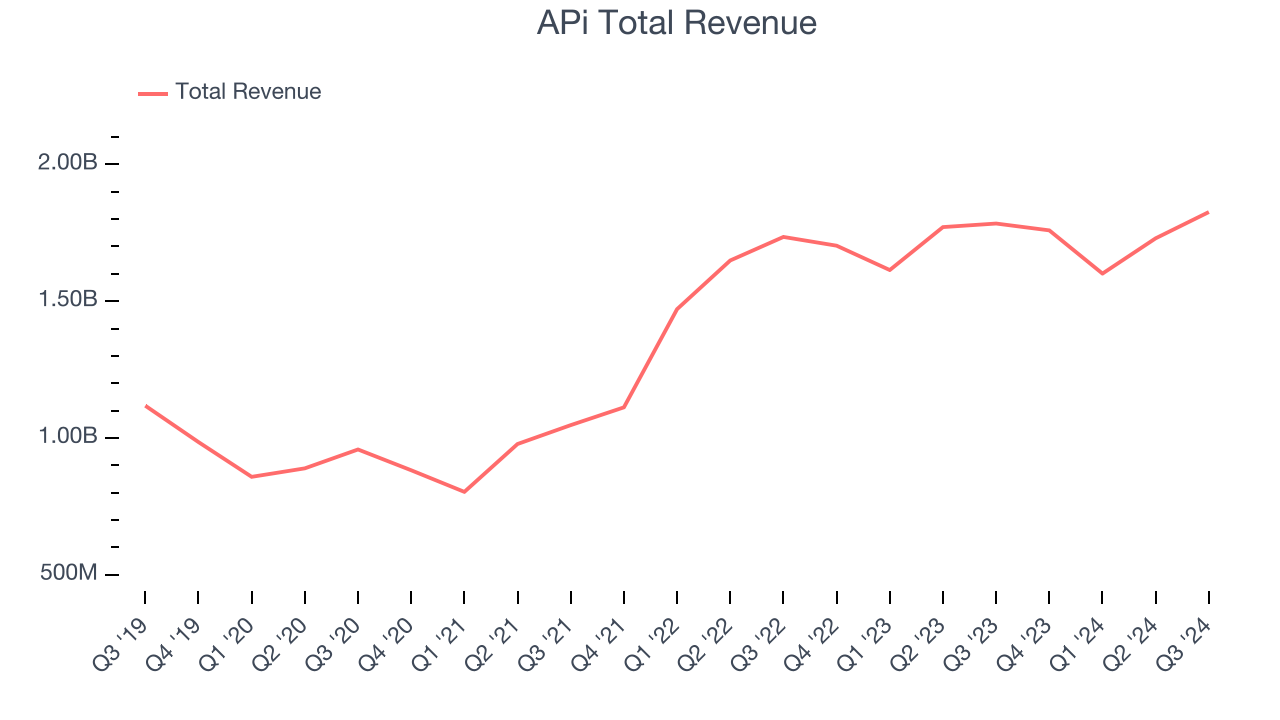
We at StockStory place the most emphasis on long-term growth, but within industrials, a half-decade historical view may miss cycles, industry trends, or a company capitalizing on catalysts such as a new contract win or a successful product line. APi’s annualized revenue growth of 7.7% over the last two years is below its five-year trend, but we still think the results were respectable. 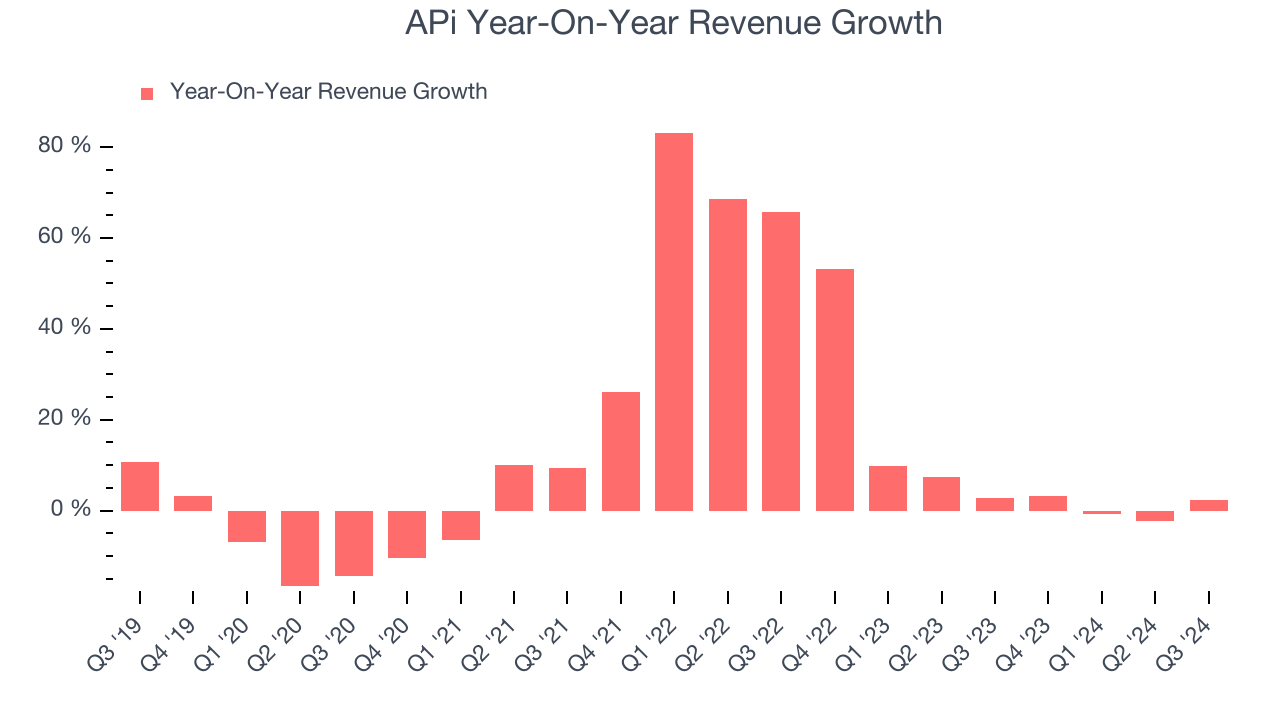
We can dig further into the company’s sales dynamics by analyzing its organic revenue, which strips out one-time events like acquisitions and currency fluctuations because they don’t accurately reflect its fundamentals. Over the last two years, APi’s organic revenue averaged 2.9% year-on-year growth. Because this number is lower than its normal revenue growth, we can see that some mixture of acquisitions and foreign exchange rates boosted its headline performance. 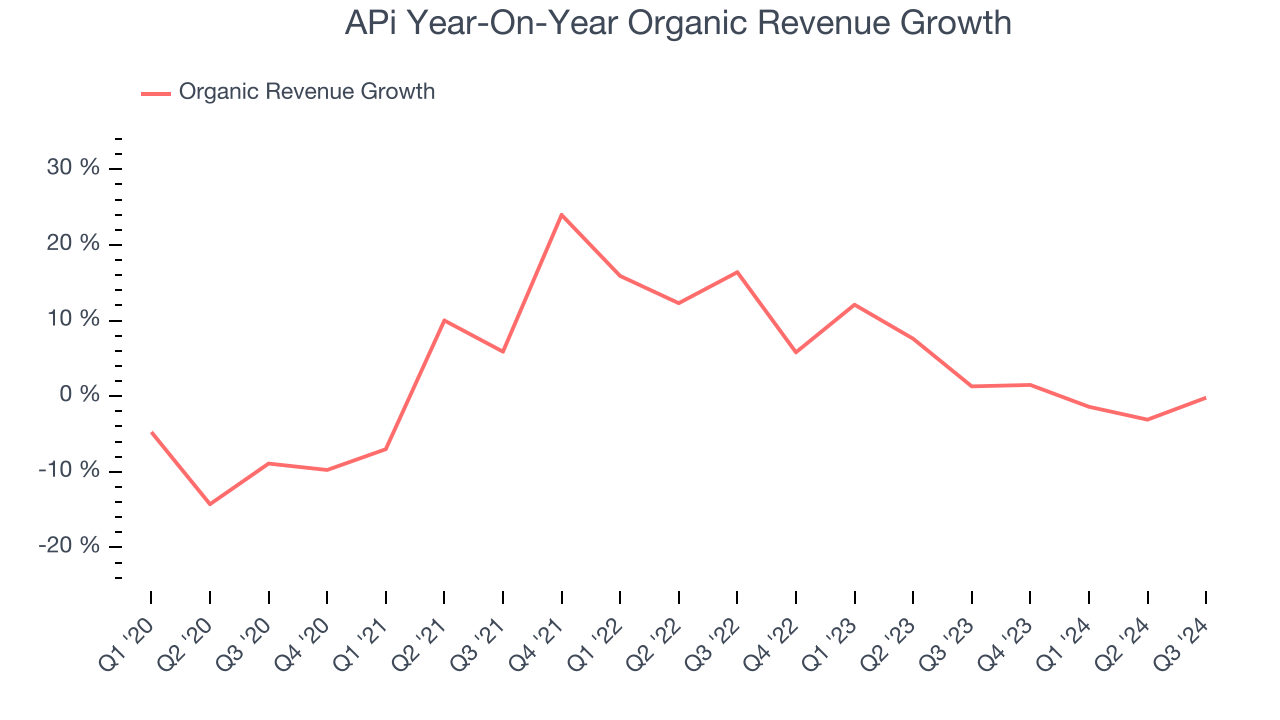
This quarter, APi’s revenue grew 2.4% year on year to $1.83 billion, falling short of Wall Street’s estimates.
Looking ahead, sell-side analysts expect revenue to grow 8.4% over the next 12 months, similar to its two-year rate. This projection is above the sector average and illustrates the market thinks its newer products and services will help sustain its historical top-line performance.
Unless you’ve been living under a rock, it should be obvious by now that generative AI is going to have a huge impact on how large corporations do business. While Nvidia and AMD are trading close to all-time highs, we prefer a lesser-known (but still profitable) semiconductor stock benefitting from the rise of AI. Click here to access our free report on our favorite semiconductor growth story.
Operating Margin
Operating margin is one of the best measures of profitability because it tells us how much money a company takes home after procuring and manufacturing its products, marketing and selling them, and, most importantly, keeping them relevant through research and development.
APi was profitable over the last five years but held back by its large cost base. Its average operating margin of 2.7% was weak for an industrials business. This result isn’t too surprising given its low gross margin as a starting point.
On the plus side, APi’s annual operating margin rose by 14.1 percentage points over the last five years, as its sales growth gave it immense operating leverage.
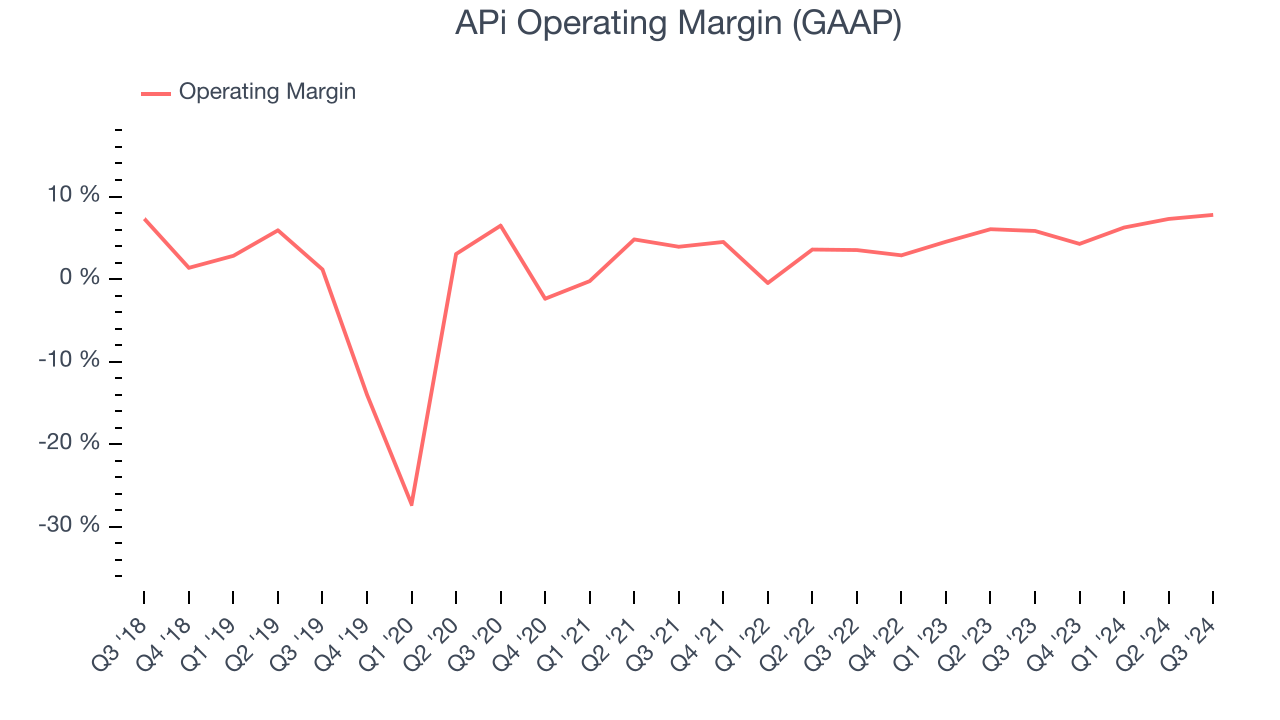
This quarter, APi generated an operating profit margin of 7.8%, up 1.9 percentage points year on year. Since its gross margin expanded more than its operating margin, we can infer that leverage on its cost of sales was the primary driver behind the recently higher efficiency.
Earnings Per Share
We track the long-term change in earnings per share (EPS) for the same reason as long-term revenue growth. Compared to revenue, however, EPS highlights whether a company’s growth was profitable.
APi’s EPS grew at an astounding 21.9% compounded annual growth rate over the last five years, higher than its 11.2% annualized revenue growth. This tells us the company became more profitable as it expanded.
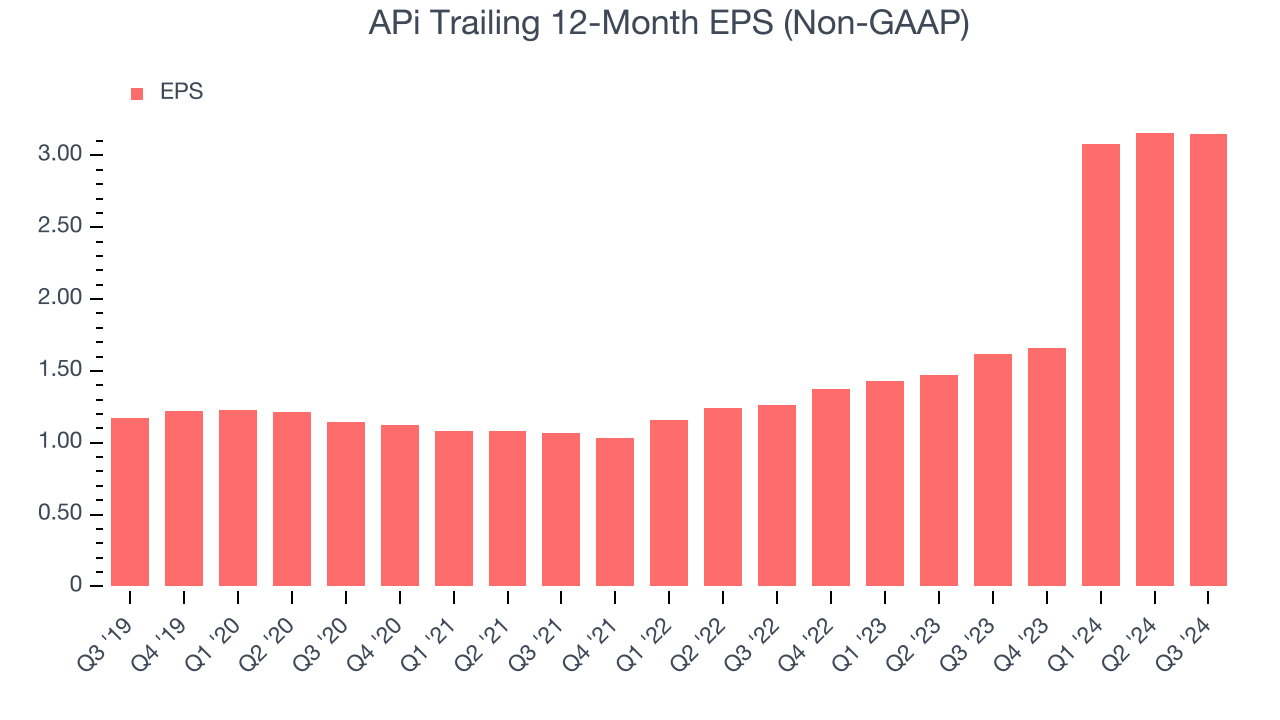
Diving into the nuances of APi’s earnings can give us a better understanding of its performance. As we mentioned earlier, APi’s operating margin expanded by 14.1 percentage points over the last five years. This was the most relevant factor (aside from the revenue impact) behind its higher earnings; taxes and interest expenses can also affect EPS but don’t tell us as much about a company’s fundamentals.
Like with revenue, we analyze EPS over a more recent period because it can give insight into an emerging theme or development for the business.
For APi, its two-year annual EPS growth of 58.1% was higher than its five-year trend. We love it when earnings growth accelerates, especially when it accelerates off an already high base.In Q3, APi reported EPS at $0.51, down from $0.52 in the same quarter last year. This print was close to analysts’ estimates. Over the next 12 months, Wall Street expects APi’s full-year EPS of $3.15 to shrink by 33.6%.
Key Takeaways from APi’s Q3 Results
We struggled to find many strong positives in these results. Its revenue missed and its organic revenue fell short Wall Street’s estimates. The company also lowered its full year revenue and EBITDA guidance. Overall, this was a softer quarter. The stock remained flat at $33.21 immediately after reporting.
So should you invest in APi right now? The latest quarter does matter, but not nearly as much as longer-term fundamentals and valuation, when deciding if the stock is a buy. We cover that in our actionable full research report which you can read here, it’s free.


