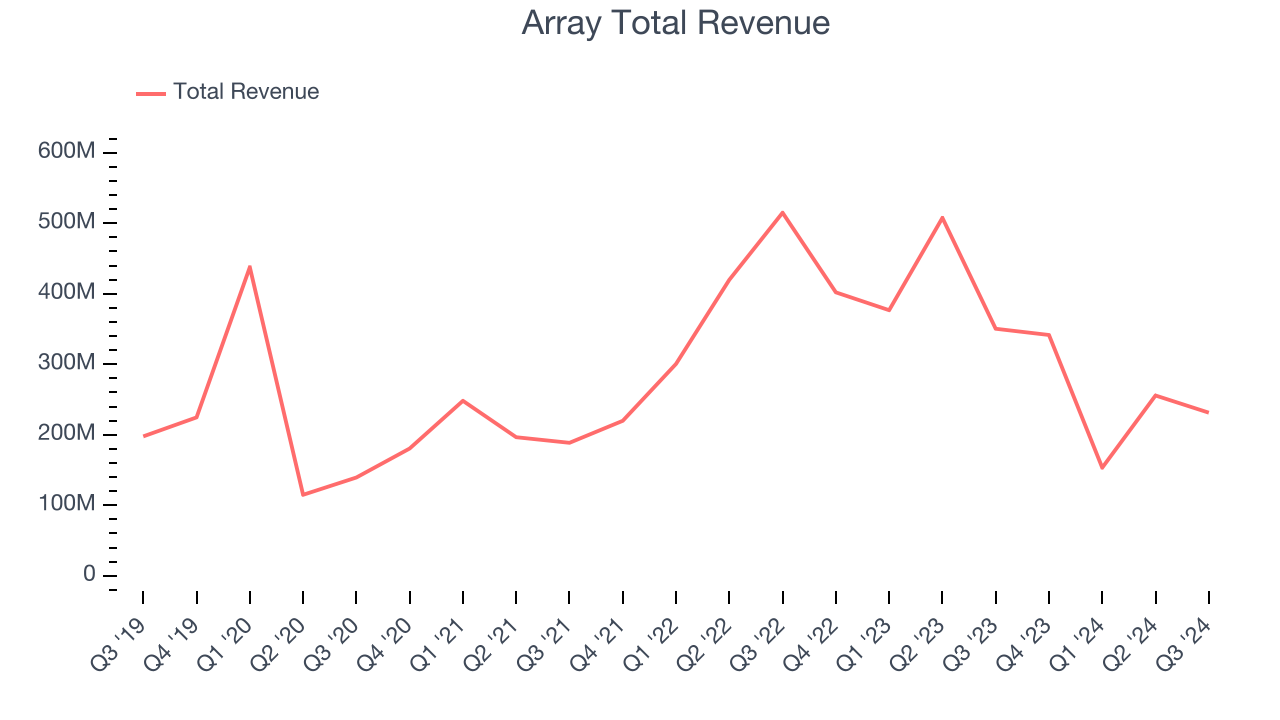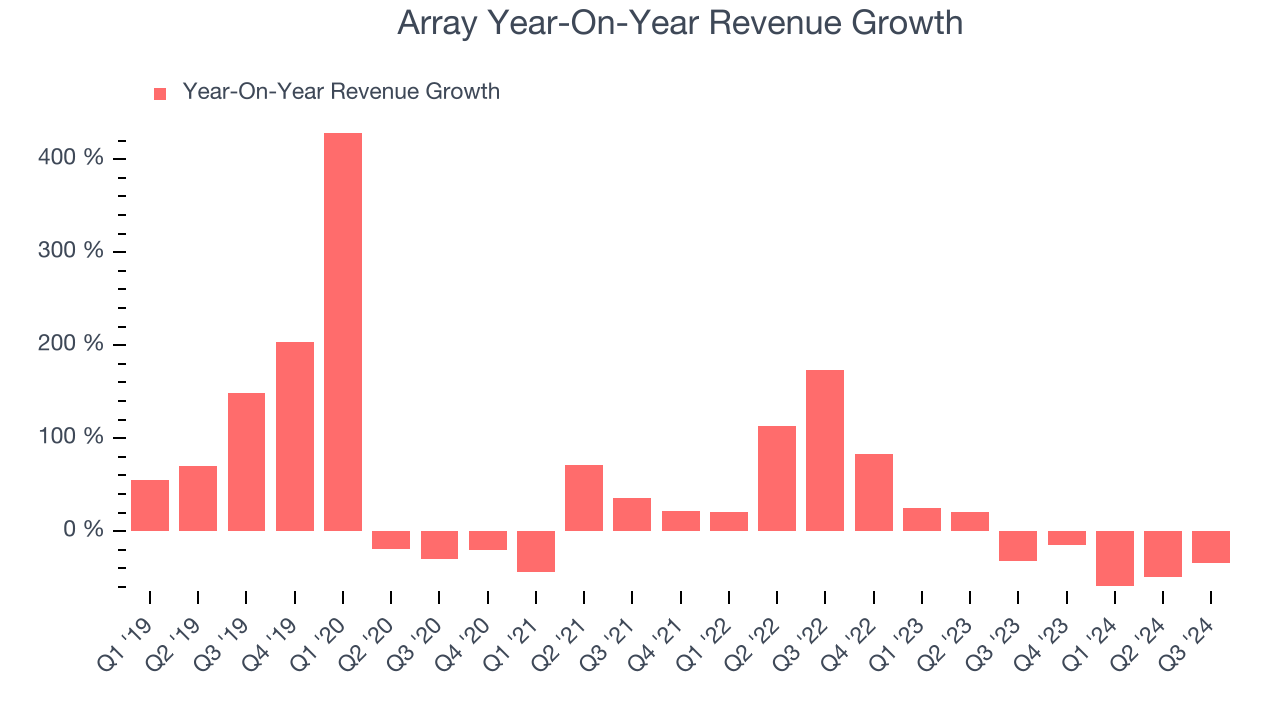
Solar tracking systems manufacturer Array (NASDAQ:ARRY) met Wall Street’s revenue expectations in Q3 CY2024, but sales fell 34% year on year to $231.4 million. The company’s full-year revenue guidance of $910 million at the midpoint came in 3.7% below analysts’ estimates. Its non-GAAP profit of $0.17 per share was 25.5% above analysts’ consensus estimates.
Is now the time to buy Array? Find out by accessing our full research report, it’s free.
Array (ARRY) Q3 CY2024 Highlights:
- Revenue: $231.4 million vs analyst estimates of $232.9 million (in line)
- Adjusted EPS: $0.17 vs analyst estimates of $0.14 (25.5% beat)
- EBITDA: $46.72 million vs analyst estimates of $45.69 million (2.3% beat)
- The company dropped its revenue guidance for the full year to $910 million at the midpoint from $950 million, a 4.2% decrease
- Management lowered its full-year Adjusted EPS guidance to $0.63 at the midpoint, a 9.4% decrease
- EBITDA guidance for the full year is $175 million at the midpoint, below analyst estimates of $193.9 million
- Gross Margin (GAAP): 33.8%, up from 24.9% in the same quarter last year
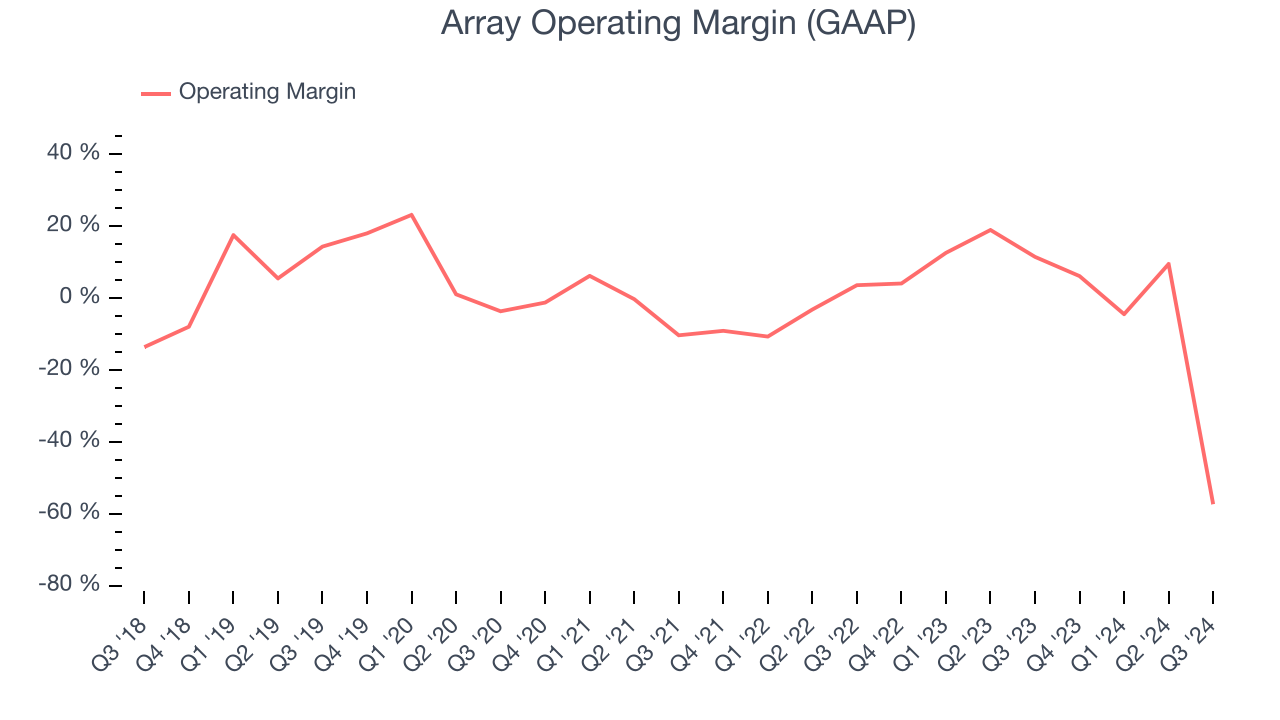
- Operating Margin: -57.3%, down from 11.5% in the same quarter last year due to a one-time impairment charge
- EBITDA Margin: 20.2%, up from 16.4% in the same quarter last year
- Free Cash Flow Margin: 19%, similar to the same quarter last year
- Market Capitalization: $902.4 million
“ARRAY had another impressive quarter of operational execution, achieving revenue within our guidance range and strong profitability, as evidenced by our adjusted gross margin of 35.4%. Our orderbook remains healthy at $2 billion, with over 20% of our global orderbook now representing orders of OmniTrack™, which demonstrates the rapid expansion of solar projects utilizing land with diverse terrain. Additionally, a significant portion of orders in our domestic orderbook include customers evaluating domestic content, and we remain confident in our ability to provide 100% domestic trackers. Our high-probability pipeline remains robust, and we are greatly encouraged by the overall momentum in the business,” said Chief Executive Officer, Kevin Hostetler.
Company Overview
Going public in October 2020, Array (NASDAQ:ARRY) is a global manufacturer of ground-mounting tracking systems for utility and distributed generation solar energy projects.
Renewable Energy
Renewable energy companies are buoyed by the secular trend of green energy that is upending traditional power generation. Those who innovate and evolve with this dynamic market can win share while those who continue to rely on legacy technologies can see diminishing demand, which includes headwinds from increasing regulation against “dirty” energy. Additionally, these companies are at the whim of economic cycles, as interest rates can impact the willingness to invest in renewable energy projects.
Sales Growth
A company’s long-term performance can give signals about its business quality. Even a bad business can shine for one or two quarters, but a top-tier one grows for years. Thankfully, Array’s 14.6% annualized revenue growth over the last five years was exceptional. This is a useful starting point for our analysis.

Long-term growth is the most important, but within industrials, a half-decade historical view may miss new industry trends or demand cycles. Array’s recent history marks a sharp pivot from its five-year trend as its revenue has shown annualized declines of 17.8% over the last two years. 
This quarter, Array reported a rather uninspiring 34% year-on-year revenue decline to $231.4 million of revenue, in line with Wall Street’s estimates.
Looking ahead, sell-side analysts expect revenue to grow 16.6% over the next 12 months, an improvement versus the last two years. This projection is admirable and shows the market believes its newer products and services will catalyze higher growth rates.
When a company has more cash than it knows what to do with, buying back its own shares can make a lot of sense–as long as the price is right. Luckily, we’ve found one, a low-priced stock that is gushing free cash flow AND buying back shares. Click here to claim your Special Free Report on a fallen angel growth story that is already recovering from a setback.
Operating Margin
Array was profitable over the last five years but held back by its large cost base. Its average operating margin of 3.3% was weak for an industrials business. This result isn’t too surprising given its low gross margin as a starting point.
Looking at the trend in its profitability, Array’s annual operating margin decreased by 24.7 percentage points over the last five years. The company’s performance was poor no matter how you look at it. It shows operating expenses were rising and it couldn’t pass those costs onto its customers.

In Q3, Array generated an operating profit margin of negative 57.3%, down 68.8 percentage points year on year. This is due to a one-time goodwill impairment charge that is non-recurring.
Earnings Per Share
Analyzing revenue trends tells us about a company’s historical growth, but the long-term change in its earnings per share (EPS) points to the profitability of that growth – for example, a company could inflate its sales through excessive spending on advertising and promotions.
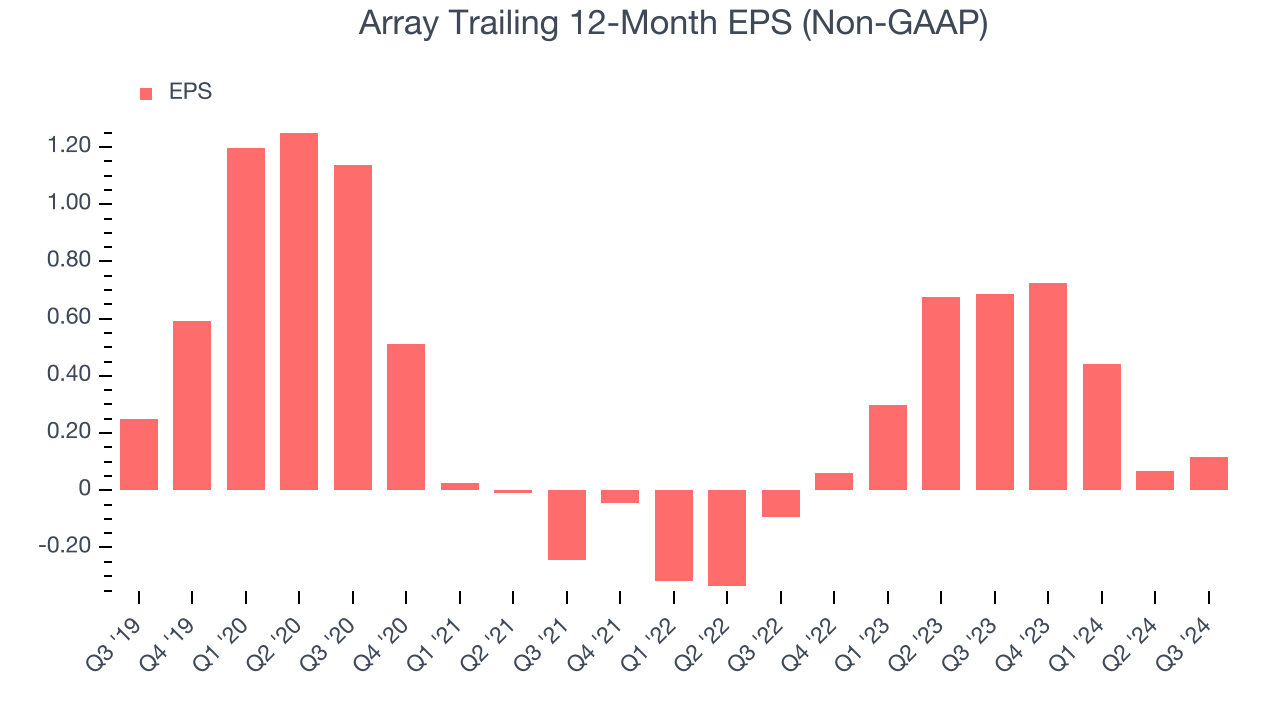
Sadly for Array, its EPS declined by 14.3% annually over the last five years while its revenue grew by 14.6%. This tells us the company became less profitable on a per-share basis as it expanded.

Diving into the nuances of Array’s earnings can give us a better understanding of its performance. As we mentioned earlier, Array’s operating margin declined by 24.7 percentage points over the last five years. This was the most relevant factor (aside from the revenue impact) behind its lower earnings; taxes and interest expenses can also affect EPS but don’t tell us as much about a company’s fundamentals.
Like with revenue, we analyze EPS over a more recent period because it can give insight into an emerging theme or development for the business.
For Array, its two-year annual EPS growth of 79.5% was higher than its five-year trend. This acceleration made it one of the faster-growing industrials companies in recent history.In Q3, Array reported EPS at $0.17, up from $0.12 in the same quarter last year. This print easily cleared analysts’ estimates, and shareholders should be content with the results. Over the next 12 months, Wall Street expects Array’s full-year EPS of $0.12 to grow by 632%.
Key Takeaways from Array’s Q3 Results
The quarter was solid, with revenue and EPS beating. On the other hand, its full-year revenue guidance missed and its EBITDA guidance for the full year fell short of Wall Street’s estimates. Both guidance items were also lowered from previous, which is never a good sign. Overall, this was a softer quarter. The stock traded down 7.6% to $5.70 immediately following the results.
Array underperformed this quarter, but does that create an opportunity to invest right now? What happened in the latest quarter matters, but not as much as longer-term business quality and valuation, when deciding whether to invest in this stock. We cover that in our actionable full research report which you can read here, it’s free.


